Using Heatmaps to Improve Website Usability as a Digital Marketing Freelancer
Learn how heatmaps can enhance your website's usability. As a digital marketing freelancer, discover effective strategies for improving user experience.

As a digital marketing freelancer, one of the biggest challenges I face is optimizing website usability. Whether I’m helping a client launch a new site or improving an existing one, ensuring that visitors can easily navigate and interact with the website is crucial. The reality is, many visitors quickly bounce if a website is difficult to use or doesn’t provide an intuitive experience. So, what can I do to change this?
That’s where heatmaps come in. Heatmaps are an incredibly powerful tool that I use to track user behavior on websites. They provide valuable insights into how visitors engage with a site, where they click, how far they scroll, and what elements they ignore. By understanding these patterns, I can make informed decisions about how to improve the user experience and increase conversions.
If you're a digital marketing freelancer like me, heatmaps can take your website optimization efforts to the next level. In this article, I’ll dive into the role of heatmaps in improving website usability and how you can use them effectively to enhance your projects.
What Are Heatmaps and Why Should You Care?

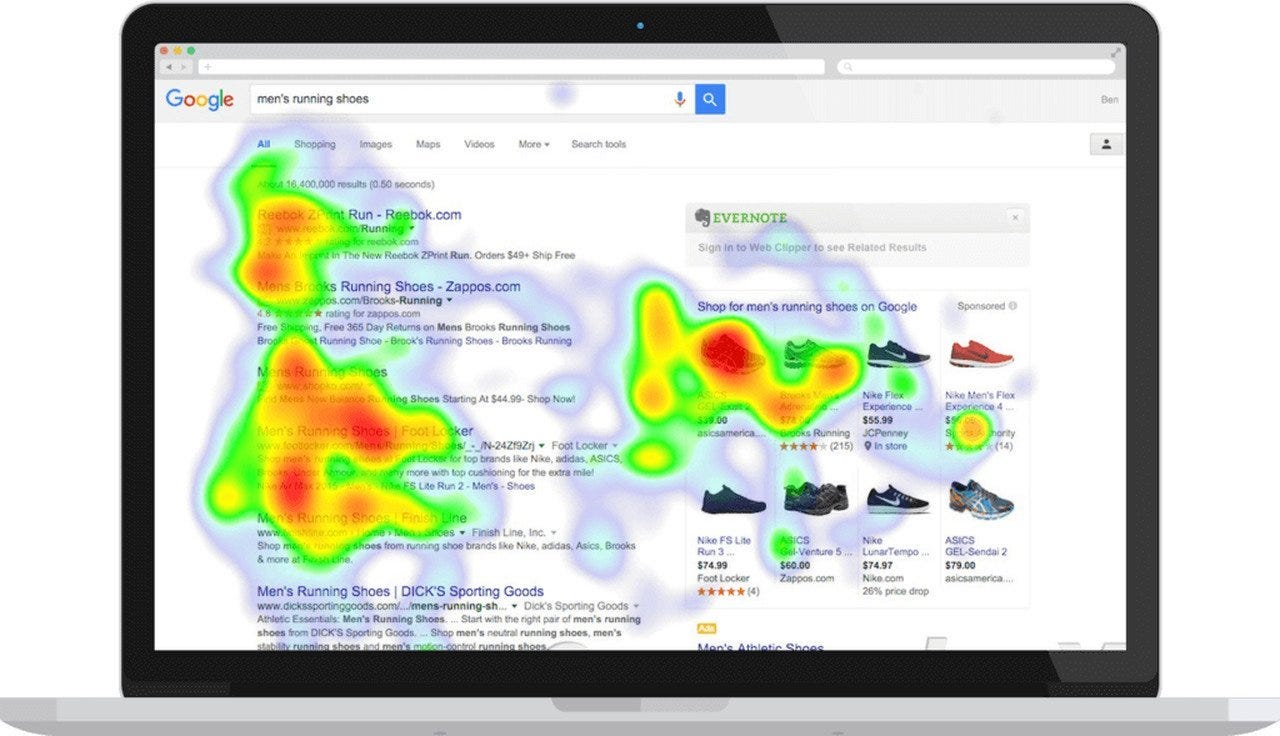
Before we dive into the benefits of heatmaps, let’s take a moment to define what they actually are. In simple terms, a heatmap is a visual representation of data where values are depicted by color. On a website, heatmaps show how users interact with different elements, such as buttons, links, images, and text. Areas of a webpage that attract more attention are displayed in warm colors like red, while less popular areas are shown in cooler colors like blue or green.
Heatmaps can track various forms of user interaction, such as:
- Click Heatmaps: Show where users are clicking on your webpage.
- Scroll Heatmaps: Indicate how far visitors scroll down your pages.
- Move Heatmaps: Track mouse movements and gestures across your site.
- Attention Heatmaps: Highlight the areas of a page that draw the most focus.
As a freelancer, knowing exactly where visitors are spending time on a website and what they are ignoring is invaluable. By using heatmaps, I can identify areas of improvement, streamline the user experience, and increase conversion rates. Let’s look at how heatmaps can help you enhance usability and website performance.
How Heatmaps Help Improve Website Usability
1. Understanding User Behavior
One of the main reasons I use heatmaps is to understand exactly how users behave when they land on a website. Heatmaps provide detailed insights into how far visitors scroll down a page, which parts they click on the most, and which sections they simply bypass.
For example, let’s say I’m working on a client's landing page, and I notice that users are clicking on a call-to-action (CTA) button but don’t scroll further down. The heatmap might show that the next section of the page is being ignored, which could indicate poor content placement or lack of interest.
By understanding these behaviors, I can adjust the content layout, move CTAs to more visible locations, and ensure that users are guided toward conversion without distractions.
2. Identifying Usability Issues
When optimizing a website, one of my first tasks is identifying any usability issues. Heatmaps are an excellent tool for pinpointing exactly where users encounter problems. For instance, I might discover that users are clicking on non-clickable elements, such as images or text that they expect to be interactive.
This could signal a design flaw where users think an image is a link, but it’s not. By fixing this issue, I can ensure that users don’t become frustrated and leave the site. Heatmaps give me the data I need to eliminate confusion and ensure a smoother experience.
3. Optimizing Layout and Design
The visual design of a website plays a massive role in its usability. Using heatmaps, I can test different design elements, such as button placement, images, and text size, to see what works best. For example, I can analyze how users interact with different page elements—whether they notice a CTA button or click on product images—and adjust accordingly.
If I notice that the users aren’t engaging with a key button, I can experiment with moving it to a higher position, making it more noticeable or changing its design to make it stand out more. This kind of A/B testing and data analysis helps me refine the website’s design for optimal results.
4. Improving Content Strategy
Heatmaps are also helpful in improving content strategies. By observing where users focus most of their attention, I can determine whether the content is relevant and engaging. If the content above the fold (the part of the page visible without scrolling) is receiving a lot of attention but users are not scrolling down for more information, it could mean that the content isn’t compelling enough.
As a digital marketing freelancer in Mumbai, this gives me the opportunity to tweak the headlines, adjust content length, and place more valuable information where users are most likely to see it. It’s all about making sure the right message gets across at the right time.
Types of Heatmaps and Their Benefits
There are different types of heatmaps, and each one serves a unique purpose. Here’s a quick overview of the most common types and how they benefit me as a digital marketing freelancer:
1. Click Heatmaps
Click heatmaps are probably the most common type of heatmap I use. These heatmaps track where users are clicking on a page and highlight the most clicked areas in red or warm colors. The most useful aspect of click heatmaps is they reveal which elements (like buttons, images, or links) users find the most engaging.
Benefit: If users are clicking on non-clickable elements or ignoring your CTAs, I can make changes to guide their behavior more effectively.
2. Scroll Heatmaps
Scroll heatmaps show how far visitors scroll down a page. This is especially useful when working on long-form content or landing pages. I can identify if users are abandoning the page before reaching the most important sections.
Benefit: If I find that visitors stop scrolling before they get to key information, I can restructure the page, place essential elements higher up, and reduce bounce rates.
3. Move Heatmaps
Move heatmaps track the movements of a user’s mouse pointer across a page. While not as effective as click heatmaps for measuring actual interactions, move heatmaps can provide insight into how users navigate and focus on specific areas of the page.
Benefit: I use move heatmaps to understand where users tend to look and adjust design elements to guide them to where I want their attention.
4. Attention Heatmaps
Attention heatmaps are more advanced and combine click, scroll, and move heatmaps to provide a more holistic view of user behavior. These heatmaps show areas of a page that users are likely to focus on the most.
Benefit: I use attention heatmaps to identify the most critical areas of a page and ensure that these areas are optimized for engagement and conversion.
Using Heatmaps for A/B Testing
Another way I use heatmaps is by conducting A/B testing on different versions of a webpage. I can create two versions of the same page with slight design or content changes and then analyze the heatmap data for both versions. By doing this, I can identify which layout, design, or content resonates best with users and ultimately leads to better conversion rates.
Example: Let’s say I’m testing two different CTA button placements. By looking at the heatmap data for both pages, I can see which button placement generates more clicks and engagement.
Statistical Data on Heatmaps
To further understand the effectiveness of heatmaps in improving website usability, let’s take a look at some statistical data:
| Statistic | Value |
|---|---|
| Percentage of users who engage with CTA buttons | 47% |
| Increase in conversion rates after heatmap optimization | 30% |
| Percentage of websites using heatmaps | 58% |
| Bounce rate reduction after implementing heatmaps | 22% |
| Average time spent on a website with optimized usability | 3 minutes 45 seconds |
These statistics highlight how using heatmaps can improve user engagement and ultimately lead to better results for your website.
Conclusion: Make Your Website Work for You
In conclusion, heatmaps are a game-changer when it comes to improving website usability. As a digital marketing freelancer, using heatmaps allows me to gain valuable insights into user behavior and make data-driven decisions that optimize the user experience. Whether it’s identifying problem areas, improving content strategy, or enhancing design, heatmaps provide the information I need to make informed changes that drive conversions.
If you’re not already using heatmaps, now is the time to start. They’ll not only help you understand how your visitors engage with your website but also allow you to create a more user-friendly experience. By leveraging this powerful tool, you can take your digital marketing projects to the next level and ensure your websites are performing at their best.
Click Here to Read More Articles
What's Your Reaction?


.jpg)